New Funding for 3D Visualization
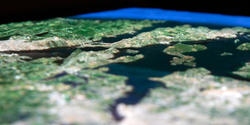
Researchers involved with the Rhode Island Consortium for Coastal Ecology Assessment Innovation and Modeling (RI C-AIM) have been tracking the effects of climate change on Rhode Island’s waters for years, building computer models that predict everything from rising tides and temperatures to changes in salinity and the effects of such shifts on marine life. But presenting complicated data in a format that’s useful for nonscientists—such as policymakers committed to protecting the state’s coastal ecosystem—has long been a problem.
“This project takes the first essential step in helping both professional and lay audiences understand complex system dynamics.”
Now a $60,000 grant from STAC (Rhode Island’s Science and Technology Advisory Council) is allowing artists and designers working at RISD’s Edna W. Lawrence Nature Lab to develop a 3D visualization platform that will help the general public understand bay dynamics and anthropogenic impacts on the estuary.
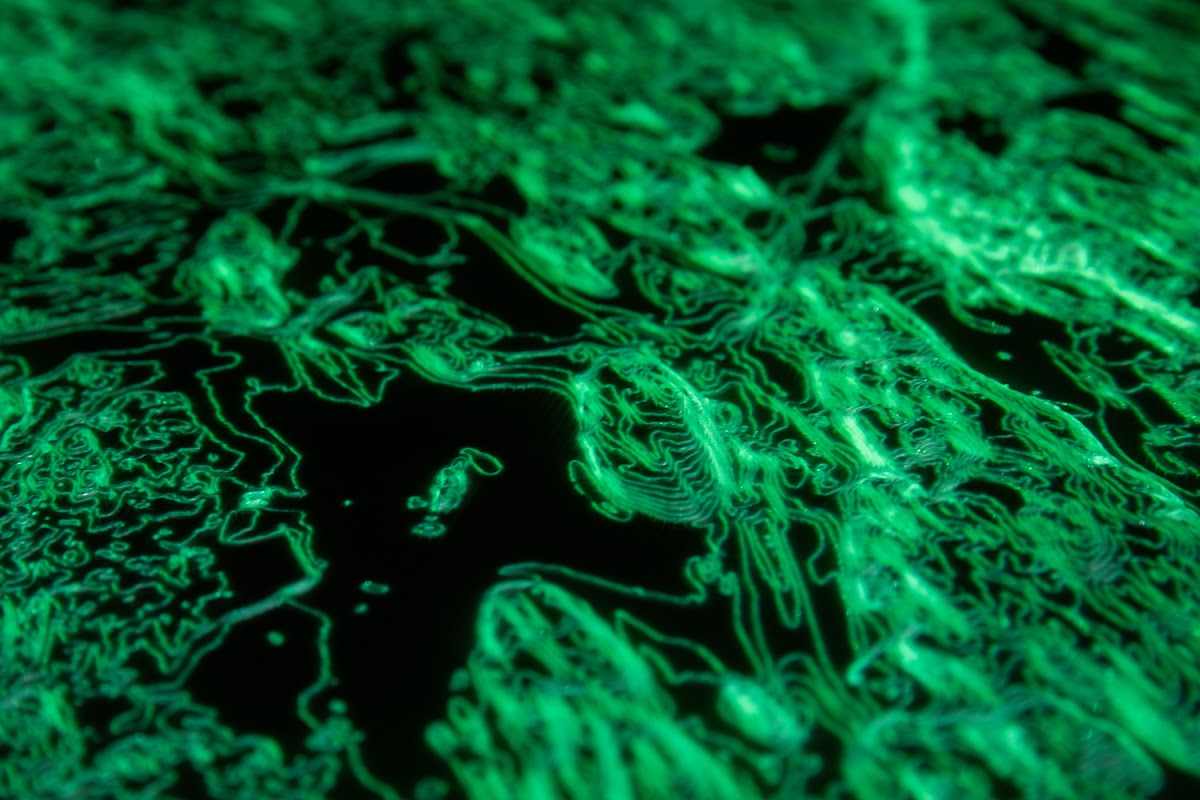
The RISD team, led by principal investigator Jen Bissonnette (interim director of the Nature Lab) and co-PIs Georgia Rhodes and Stewart Copeland MFA 19 DM, explains that the tool will initially be used to promote collaboration among researchers seeking to visualize and refine results from the Ocean State Ocean Model for the Narragansett Bay. They’ll work with Brown University faculty member and project co-PI Baylor Fox-Kemper and Brown doctoral candidate/co-PI Aakash Sane, who is running computer simulations to better understand the physical processes in the bay.
Ultimately, the new tool will be applied more widely, promoting communication among University of Rhode Island scientists and improving the visibility and coherence of the diverse work being conducted in the Narragansett Bay Observatory. Use of the platform may also be extended to faculty in Rhode Island institutions for use in related courses.
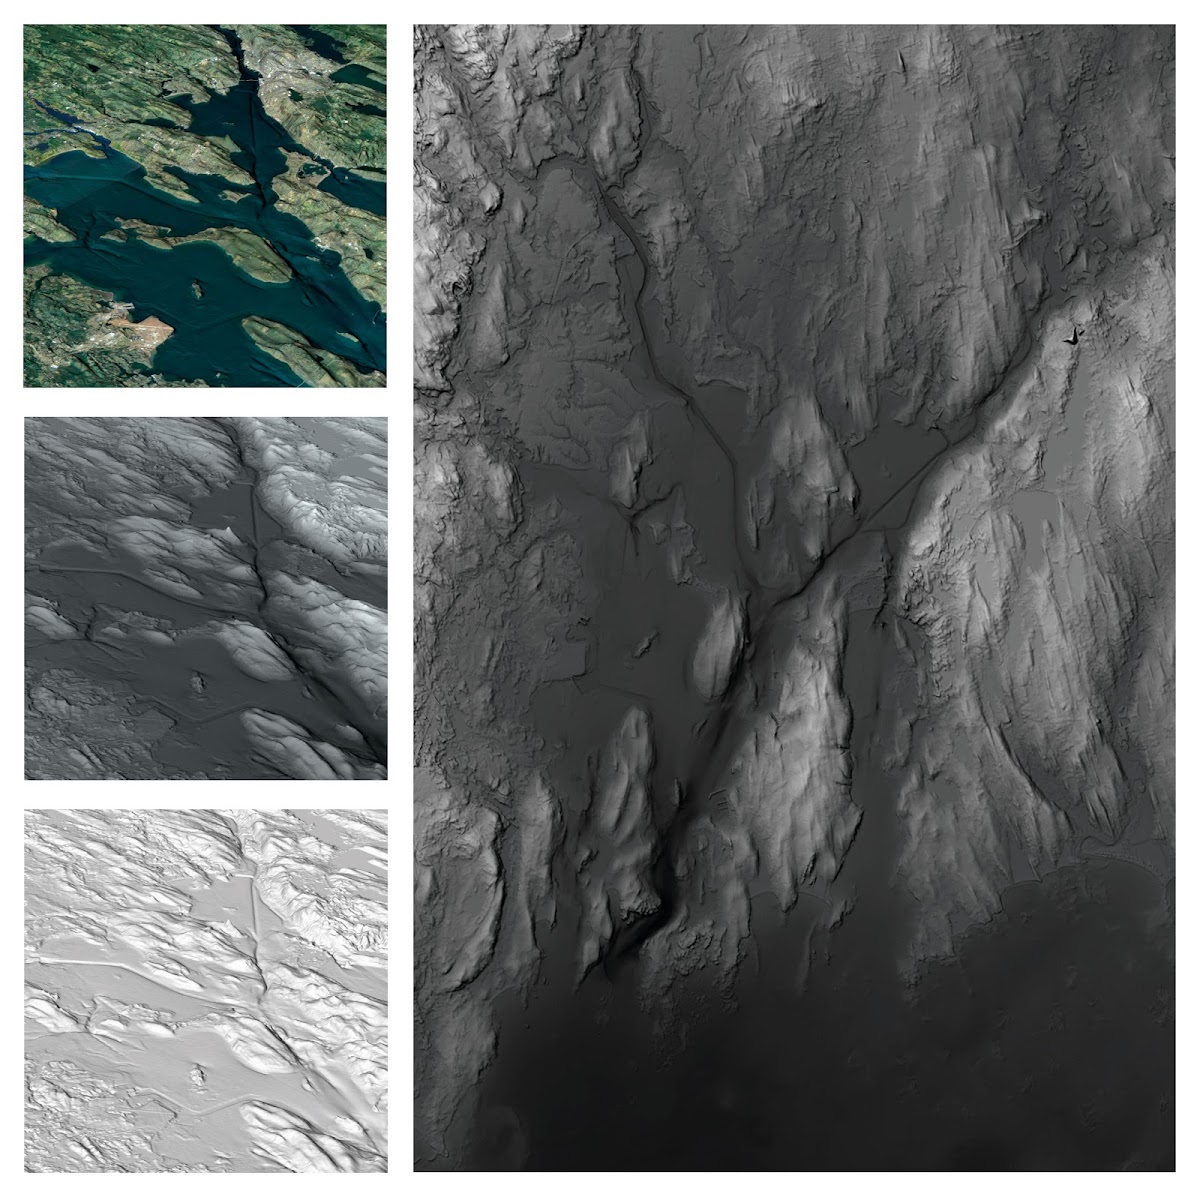
“This project takes the first essential step in transforming model data into 3D meshes that help both professional and lay audiences understand complex system dynamics,” says Copeland. The polygonal meshes are derived from individual data points, resulting in a computer-generated model that can be 3D-printed to create a scale model. That model is then used as a platform for projection mapping: a process by which computer software aligns a projected image with a complex physical surface.
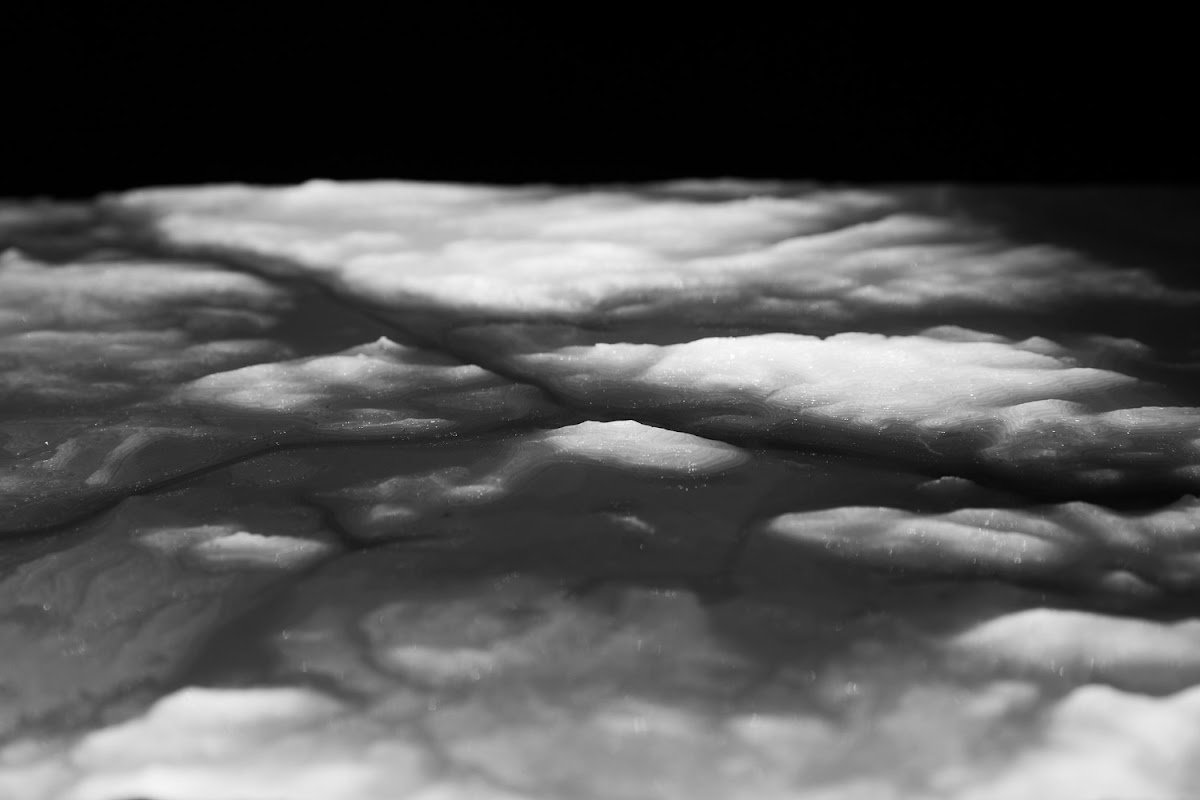
“This visualization strategy [provides] a unique platform for advancing collaborative understanding of Rhode Island’s marine ecosystem.”
“The ability to represent climate modeling and data simulations in geospatially sound, 2- and 3D environments will allow researchers to communicate complex findings in ways that can be adapted to different audiences and purposes,” says Rhodes. And these developments will advance Rhode Island’s core capacity for visualization, generating a library of visualization strategies that can be shared by researchers and innovators across the state.
“The large-scale projection of these data visualizations onto a 3D model of the Narragansett Bay turns this data into a mobile theater,” Copeland adds, “connecting scientists with the public and linking everyone to the bay.”
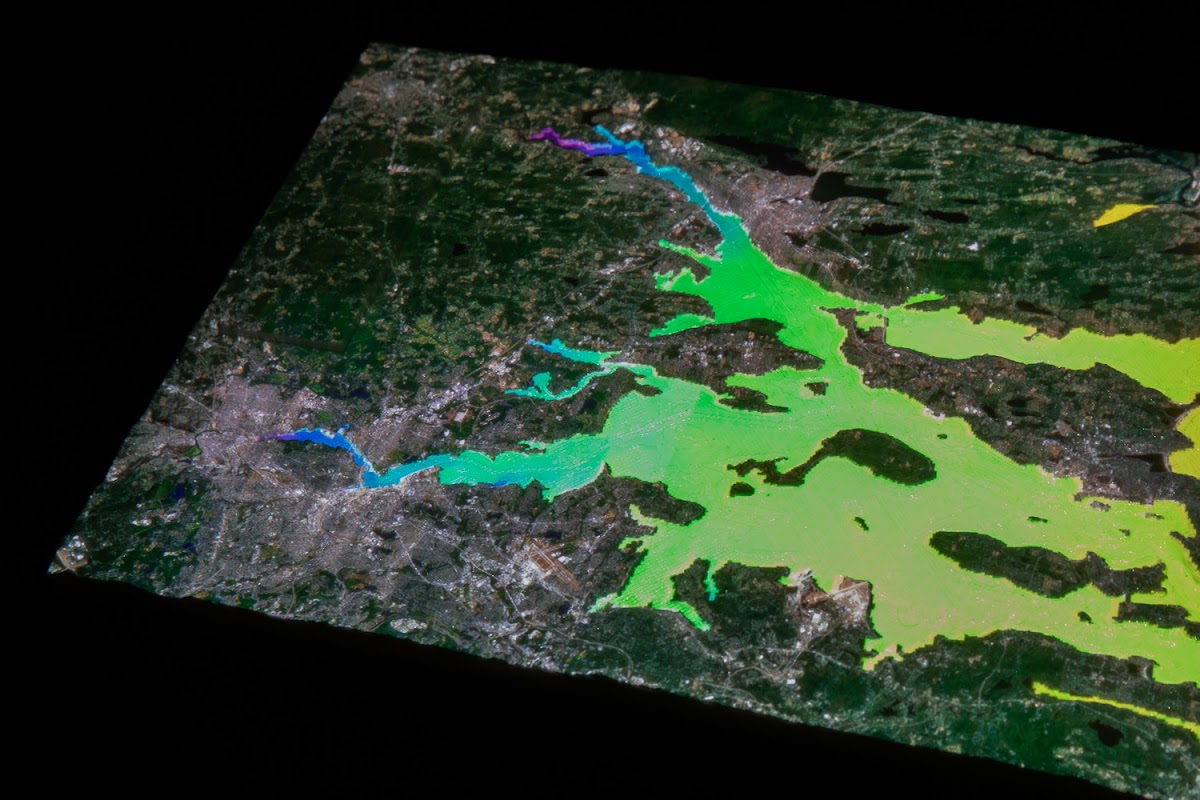
Prior to the pandemic, the team had hoped to introduce the model to the public at the beginning of summer. But despite the delay, they are still collaborating with researchers on creating visual stories about Narragansett Bay’s history and ecology and other aspects of New England’s largest estuary.
“This innovative visualization strategy combines existing knowledge with cutting-edge technology to realize a unique platform for advancing collaborative understanding of Rhode Island’s marine ecosystem,” Bissonnette notes. “And, more than that, watching the bay dynamics play out in realistic detail via vibrant graphics is a moving experience, evoking the wonder and complexity of the bay itself.”
—Simone Solondz
August 19, 2020